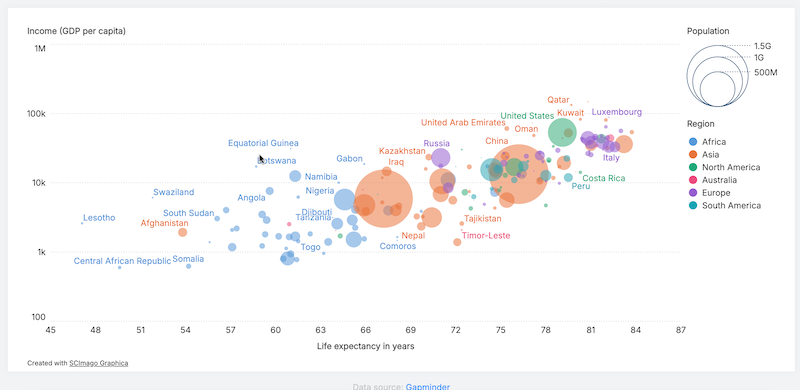
In the rapidly evolving research visualizing applications, we are going to share one of the effective tools for visualizing the bibliographic data that can be customized based on research needs. Often in the biblioshiny, some graphs for descriptive analysis or performance analysis do not look good. To overcome these limitations, this application can be useful to create graphical representations of networks and descriptive analyses.
So, we are going to share some insights about Scimago Graphica — a modern visualization tool designed specifically for the scientific community. It is a cross-platform desktop application developed by the same team behind the renowned Scimago Journal Rank (SJR). It enables researchers, analysts, and students to transform raw bibliometric data into clear, visually attractive graphs and maps. Whether you’re working on a systematic literature review or bibliometric study or exploring global collaboration networks, Scimago Graphica can be handy.
Why Use Scimago Graphica?
Here’s why Scimago Graphica is gaining traction among researchers:
1. Designed for Scientific Visualization
Unlike generic data visualization tools, Scimago Graphica is optimized for academic data — especially Scopus and Web of Science outputs. This makes it perfect for analyzing co-authorship, co-citation, keyword co-occurrence, and institutional collaborations.
2. Interactive & Intuitive UI
The drag-and-drop interface lets users explore relationships between entities in real-time. You can highlight connections, filter nodes, and zoom in on particular research areas with ease.
3. Customizable Aesthetics
You’re not stuck with default visuals. Scimago Graphica allows extensive customization — change node sizes, colors, labels, and edge strengths to make your graph not only informative but also publication-ready.
4. Compatibility with Bibliometric Tools
It complements tools like VOSviewer, CiteSpace, and Bibliometrix. You can import network data in formats like .graphml, .gexf, or .csv and enrich your analysis through visually enhanced storytelling.
What can you visualize for bibliometric research?
Scimago Graphica supports multiple network types:
– Author collaboration networks
– Institutional partnerships
– Co-citation and bibliographic coupling
– Keyword co-occurrence maps
– Country- or region-based collaboration flows
Whether you’re a PhD student, research analyst, or academician, this tool adds clarity and impact to your work and bridges the gap between quantitative bibliometric research and qualitative visual story.


